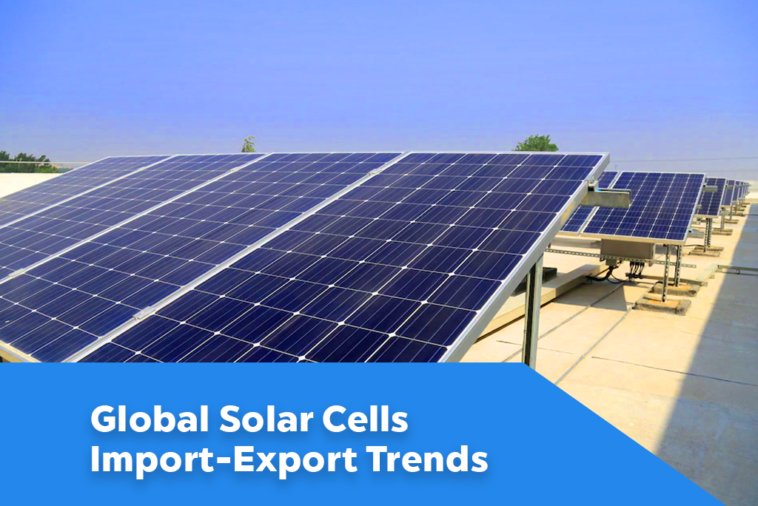
Solar panels or photovoltaic cells are increasingly finding their way into the mainstream energy generation methodologies. Solar cell trade between countries is increasingly growing and countries such as the US, China, and India are making headlong progress, inviting headlines. Imports and exports of solar cells increased in 2022 in a few countries compared to 2020.
From the COVID-19 and Russia-Ukraine war, alternative energy adoption grew and is still growing. There are several factors that have played the most significant role in the development of energy generation in several countries around the world. Countries are now leaning toward alternative energy sources than the traditional sources of energy such as fossil fuels.
The Pandemic Stricken World During COVID-19
COVID-19 is one of the most influential periods for energy generation development. Not just the development of trade policies, sustainable development also made its way into consideration by governments worldwide. It is no surprise that the inflation spark emerged from the introduction of COVID-19 in 2020. The demand for commodities increased, and so do the prices, but inversely, sluggish trade flows.
Recommendations:
Global Trade and Supply Chain Disruption Likely to Continue in H1 of 2022
Supply Chain 2022 – Growing Technologies Help Global Economies Recover from Pandemic
Solar panel imports started to grow with the rise of energy demand in many countries after the pandemic. The USA was the biggest importer of solar panels in the year 2020, followed by China, Vietnam, Hong Kong, and Japan. Below shown US import data features the trends of solar cells trade in the USA between three consecutive years – 2020, 2021, and 2022. Represented data shows the share of solar cells in the US and is calculated on the basis of four months for each selected year.

As per the shown US solar cells trade highlighting the monthly imports in each year, 2020 tops the chart. The imports in March 2021 accounted for the highest share value of imports in the USA. However, as per the total import share value accounted as a sum for these four months, 2020 is higher than 2021 and 2022. This shows that the US already began to import solar panels and put more focus on them with the emergence of the pandemic.
Recommendations:
Supply Chain 2022 – Growing Technologies Help Global Economies Recover from Pandemic
US Sanction The Extension On PV Cells For Fewer CO2 Footprints
While the US was not the alone country in the solar cells trade, it was the highest importing country. China also accounted for the highest exports of $29.9 billion in 2021. It has the capacity to manufacture solar panels in its own country. China is also building more potential to utilise solar energy in its regions. Hence, China is both importing and exporting country for solar cells trade.
Influences From The Russia-Ukraine War
The Russian invasion of Ukraine impacted international trade as both countries account for a significant share of major commodities. While Russia exports crude oil and wheat a significant amount, Ukraine exports cereals and industrial products. Russian gas has a significant share in the European market, and Germany is the biggest of all for Russia (more than 50%). The European countries account for a 45% share of all imports from Russia for energy, consisting of oil, gas, and coal.
Recommendations:
Russia-Ukraine War – How Reliant is the World on Russian Oil & Gas?
Russia-Ukraine Crisis – Global Supply Chain Impact Likely
Germany accounts for the largest amount of gas imports from Russia in the whole world and the EU. About 50% of the gas imports in Germany come from Russia, as per Germany import data 2021. According to the import data of Germany, the below-shown Germany import data feature the top energy commodities from Russia. Looking at the shown data, it is clear that petroleum gas accounted for the largest share of energy imports from Russia in 2022 so far.

The EU has been the largest import market for Russian gas as an entire region. Country-wise, China might be the top importing country for Russia, but the EU is the biggest import ‘market’. The EU abandoning Russia’s energy imports meant the need for another alternative. This brought the rise of a “transition” in energy commodities trade, and in energy generation too.
Solar Cells Trade Growth After Inflation
Before the transition came, inflation rose to its highest level in 40 years in the UK and US, both at the beginning of 2022. In the UK, however, it entered a little sluggishly near around May. The prices of energy commodities influenced the authorities moreover than consumers to take action.
Recommendations:
COVID-19 Influenced The Biggest Growth Of Global Inflation
The Highest UK Inflation In 40 Years, Living Cost Soaring High
Implementation of the measures to solve the issue in the short term was to import energy commodities from alternative markets. In the long term, however, it meant alternative energy sources such as solar, wind, and geothermal. Here entered the transition, which is…
Transition From Coal To Clean Energy
The pandemic-struck world realised the impact of daily human habits on the climate. It rang bells for the need to rejuvenate the earth’s climate and environment. Not only consumers but governments started to implement the initiatives on renewable energy and reducing carbon footprints.
Recommendations:
A Brief Study On Carbon Emissions, And Of India’s Import and Export
Coal and Global Warming: A Study On Coal Trade and Its Effect
In 2020, the EU’s energy sources consisted of 17% renewable energy, including other sources. However, the country needed to do more and Russia-Ukraine was the high time the EU did it. The EU set a target of cutting down about 55% of greenhouse gas emissions by 2030. Under its “Fit for 55” proposal, the EU set the target to produce 50% ‘green hydrogen’ from renewable energy. Electrolysis was the main method adopted in producing carbon-free hydrogen.
Along with the EU efforts on hydrogen power plants, the sales of the EV also skyrocketed in 2021. The inflation added to the need for the transition as energy prices went higher in 2022.
Impossible to retain the prices of energy commodities, but the EU knew they had to take the leap of faith for the next step. What can be cheaper than the energy alternatives at the moment?
Recommendations:
EU 2030 Green Hydrogen Target Requires Huge Renewable Power
Electric Vehicles Demand Is Going Up And Likely To Grow More
Standing at an average price of $20,000 per resident’s system, a solar panel setup is cheaper than carbon-emitting energy sources such as fuel and coal. This is due to the fact that traditional sources of energy relatively getting increasingly expensive. Solar cells, made into modules, later followed by making them into particular solar panels are made into a big array. Around 20 solar panels—strung together—generate electricity and last longer than over 20-25 years or more.
Read More: Trade and Environment: Hand-In-Hand For A Sustainable Future
International Renewable Energy Agency (IRENA) shows that Asia is the highest-growing region in terms of solar energy capacity. China tops the chart as it accounts for the highest production units of solar panels in the world. The exports of China solar cells—shown below features the top exporting countries for China’s solar cells trade. The featured countries are in no order and are listed on the basis of common ranking in two consecutive years. There is also a comparison between the final values for 2020 and 2021.

The Netherlands is at the top of the shown list of exporting countries for China’s solar cells in 2020 and 2021. Export values of the Netherlands in 2020 and 2021 amounted to $3 billion and $5.6 billion. Other than the Netherlands, India took a big jump in the export growth of China’s solar cells trade. India accounted for an increase of 145.2% in solar cells exported from China. The growth in 2021 as compared to 2020 accounted for a percentile of 51.75% for China’s solar cells export.
Netherlands and Germany are the most significant EU countries in transition toward clean energy. As shown in the above trade data, these two accounted for export growth in the solar cells trade. Germany produces its own solar panels, and its renewable power share generation accounted for almost 46% in 2020. The EU as a whole stands at the top tier in generating clean energy and utilising renewable energy.
Due to the aftermath of the Russia-Ukraine war, Italy has started transitioning towards alternative energy such as solar. Solar cells trade in Italy for the high exports of solar panels grew each quarter in 2021. The final quarter of 2021 amounted to $345.6 million for Italy. Perhaps, not only Italy now, Germany, India, the US, China and many other countries are joining in to actively participate in the solar cells trade. This marks a collective initiative by the countries to a more ‘cleaner’ transition toward renewable energy sources and reducing carbon emissions.
Recommendations:
Italy Importing Gas From Qatar, But It Might Need To Do More
How Ukraine Clean Energy Market Is Valuable To Russia and the EU?


